Javascript is not enabled.

Javascript must be enabled to use this site. Please enable Javascript in your browser and try again.

Skip to content
Content starts here
CLOSE ×
Search
CLOSE ×
Search
Leaving AARP.org Website

You are now leaving AARP.org and going to a website that is not operated by AARP. A different privacy policy and terms of service will apply.

Photo Album: Housing for a Changing America

The popular vision of the American household is inaccurate and outdated


In the decades following World War II, the typical U.S. household consisted of a married couple with children. The suburbanization of the nation was driven by this demographic, fueled by prosperity, the automobile and the dream of home ownership. Fast-forward to the 2010s, when adults living alone account for nearly 30 percent of U.S. households — and that’s a growing phenomenon across all ages and incomes. The housing supply, no matter the locale, has been slow to meet the demands of this burgeoning market or respond to the needs of increasingly varied living arrangements.

As the following slideshow presents, unprecedented shifts in demographics are redefining who we are and how we live.

Then following slideshow is adapted from Making Room: Housing for a Changing America, a free, 84-page, photo-filled AARP publication based on a National Building Museum exhibition of the same name. 

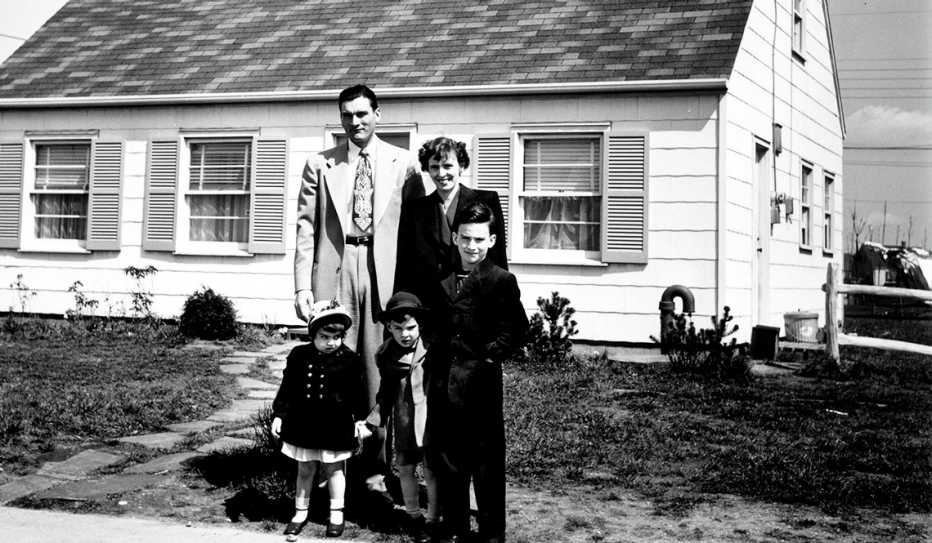
spinner image The Levey Family of Levittown, Long Island, New York.
Photo by Bernard Hoffman, LIFE magazine, May 22, 1950, Getty Images

THE AMERICAN FAMILY (THEN): The post–World War II suburbanization of the United States was driven by the housing needs of nuclear families, a group defined as two parents and their minor children. In 1950, these families (including the Leveys, shown above, of Levittown, Long Island, a New York City suburb) represented 43 percent of households. Since then, unprecedented shifts in demographics and lifestyle have redefined who we are — and how we live. Today, nuclear families account for just 20 percent of U.S. households.

spinner image The current housing stock isn't nearly as diverse as the nation's population.

THE AMERICAN HOUSEHOLD (NOW): The popular image of the American household needs updating, but so do our collective assumptions about the type of housing we need. A review of the nation’s overall housing stock by unit type reveals that more than 80 percent of the nation’s apartments and houses are built with two, three or four bedrooms. These residences are designed with a nuclear family in mind: one larger “master bedroom” for parents and smaller, secondary bedrooms for children. Additionally, there are more than twice as many two-bedroom units as there are studios and one-bedrooms combined.

spinner image Unlike in the 1950s, there are now more single person households in the U.S. than nuclear family households.

TRADING PLACES: As the chart above shows, the percentage of nuclear family households has been on a steady decline over the past 50 years while the percentage of single person households has been on the rise — so much so that there are more people living alone than as a family. 

spinner image Single people living alone is the most common household type in the U.S.

THE NUMBERS: According to the 2015 American Community Survey by the U.S. Census Bureau, single people living alone is the most common household type in the nation. The next most common: couples with no children. Children are present in less than 30 percent of U.S. households.

spinner image Three maps show state demographics for single-parent households, older adults, and single-adult households.

STATE OF THE STATES: These color-coded maps of the United States represent the percentage of each state's population that are 65 or older, that live alone or are parenting a child or children alone. (More details are provided in the next slides.)

spinner image More than 56 million Americans are now age 65 or older.

WE'RE RAPIDLY AGING: The nation’s population of older adults is experiencing unprecedented growth. By 2030, more than 1 in 5 people in the United States will be age 65 or older — and by 2035, older adults are projected to outnumber children for the first time ever.

Free, weekly, information and inspiration for local leaders 


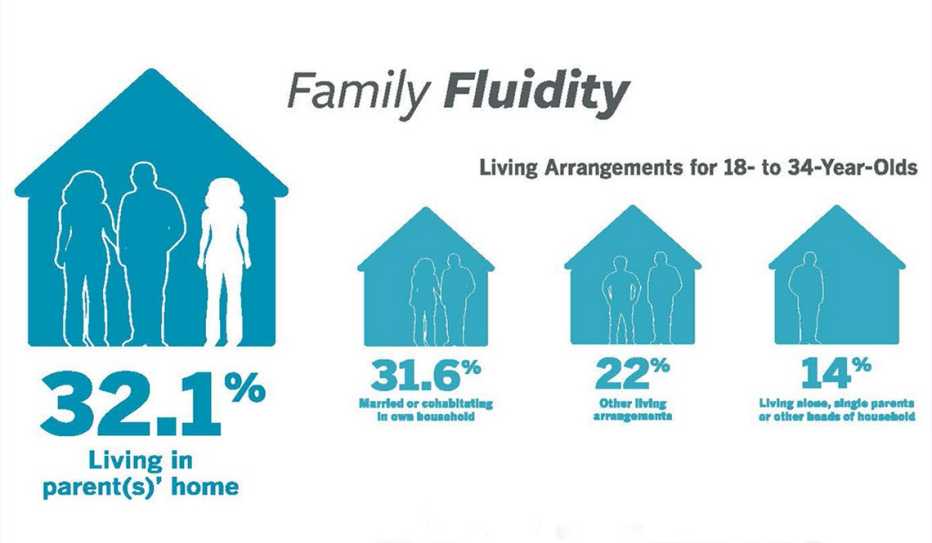
spinner image More than 30 percent of adults ages 18 to 34 years old are living in their parent(s)' home.

WE COME AND GO: Divorce, remarriage and nonmarital cohabitation result in households that change size throughout the year, month or even week. Since 2014 (and for the first time on record) living with at least one parent has become the most common living arrangement for adults ages 18 to 34.

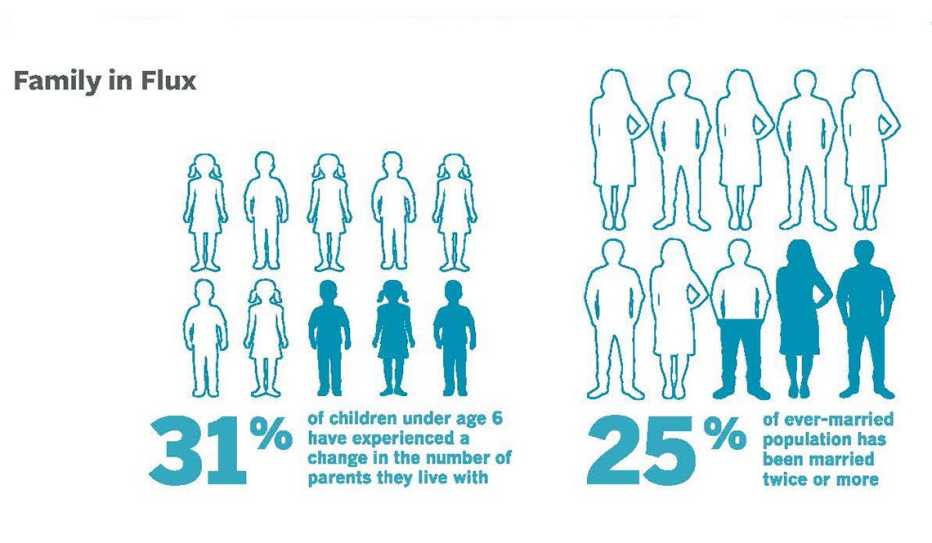
spinner image Divorce, remarriage and single parenting contribute to the changing composition of family.

FAMILY IN FLUX: The U.S. Census Bureau found that over a three-year-period, 31 percent of all children under age 6 experienced a change in the number of parents with whom they lived. 

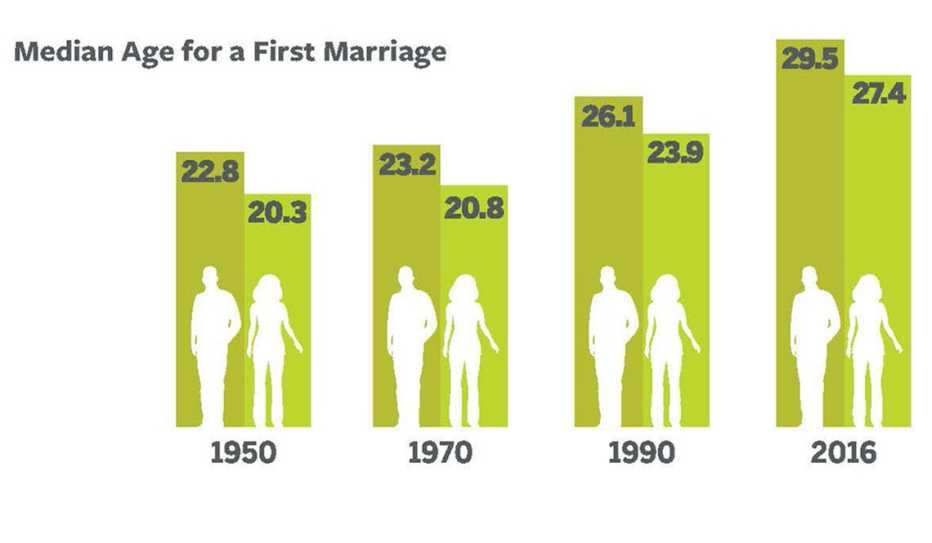
spinner image Is now near age 30 for both men and women.

LIVING SINGLE, MARRYING LATER (MAYBE): Divorce has contributed to an increase in older singles, and the trend is particularly true for women, who tend to outlive their male spouses. Nearly half, or 48 percent, of all American adults are single. Both men and women are delaying marriage. 

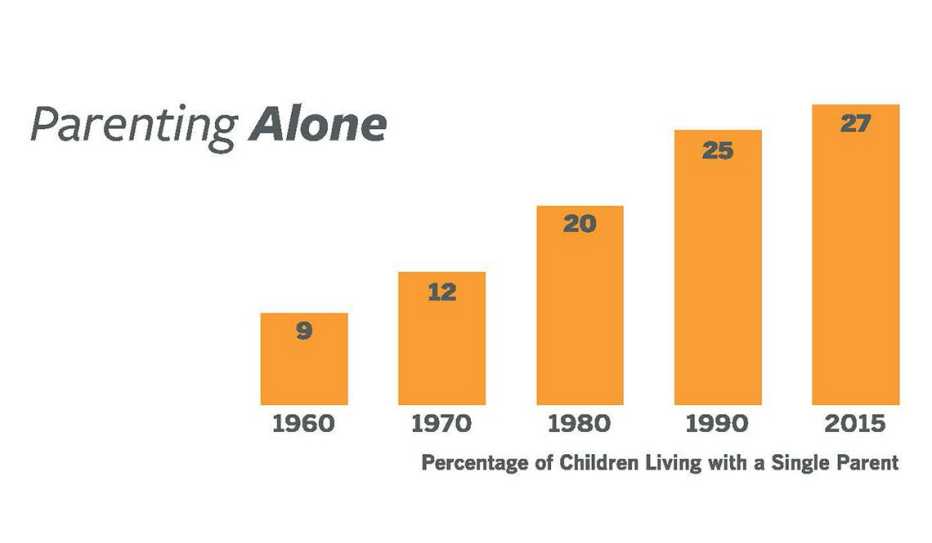
spinner image More than 1 in 4 children in the U.S. live with a single parent.

SINGLE PARENTING: The percentage of children living in a single-parent household has tripled since 1960. Single-parent households typically bring in less than half the median income of married couples. The average cost of center-based infant care exceeds that income by 24 percent. For many single parents, sharing housing and/or childcare responsibilities is a social and economic imperative.

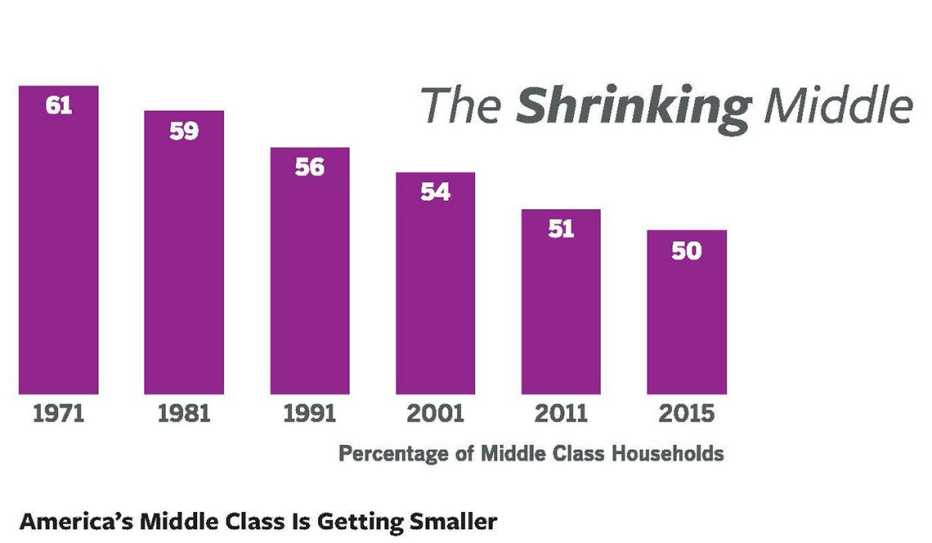
spinner image The percentage of middle class households has declined from 61 percent in 1971 to 50 percent in 2015.

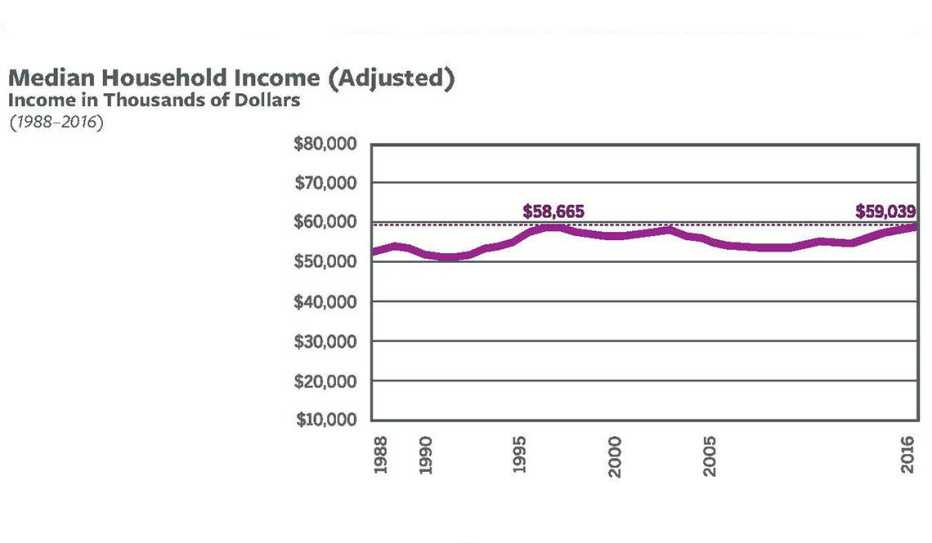
STUCK IN (OR BELOW) THE MIDDLE: In 1971, 61 percent of all U.S. households earned between half and two-thirds of the median income. By 2015, the share of households in this middle tier had dropped to 50 percent. When adjusted for inflation, the U.S. median household income is virtually the same as it was in the mid-1990s.

spinner image The median household income stagnated between 1988 and 2016.

RENT AND REAL ESTATE COSTS KEEP RISING: Although the median household income has stagnated, median home prices and rents now exceed those prior to the Great Recession. There is a widening gap between median household income and median home prices and rents.

Sources for the statistics cited in the slideshow can be found on pages 8 through 15 of Making Room: Housing for a Changing America, published in 2019 by AARP and the National Building Museum. 

Unlock Access to AARP Members Edition

Join AARP to Continue

Already a Member?

spinner image Making Room: Housing for a Changing America

Making Room: Housing for a Changing America, introduces a potential future in which people of all ages, life stages, abilities and incomes can select from a wider menu of housing options.

Page published February 2019

Unlock Access to AARP Members Edition

Join AARP to Continue

Already a Member?

More from AARP.org/Livable

 Use the dropdown to choose a livability topic.

Unlock Access to AARP Members Edition

Join AARP to Continue

Already a Member?

Unlock Access to AARP Members Edition

Join AARP to Continue

Already a Member?